Original model research · weather-v1 / schedule-v1
Do Weather and Fixture Congestion Improve Football Predictions?
We tested precipitation, wind, temperature, rest days and consecutive away games against a goals-only football model. None of the 60 comparisons met our rule for changing published probabilities. That does not show that weather or fatigue has no effect on football.
Rain can change how a match is played, and a busy schedule can affect recovery. The useful prediction question is narrower: do the data we can obtain add reliable information beyond the team strengths and home advantage already in the model?
Does rain improve match-result predictions?
Study finding
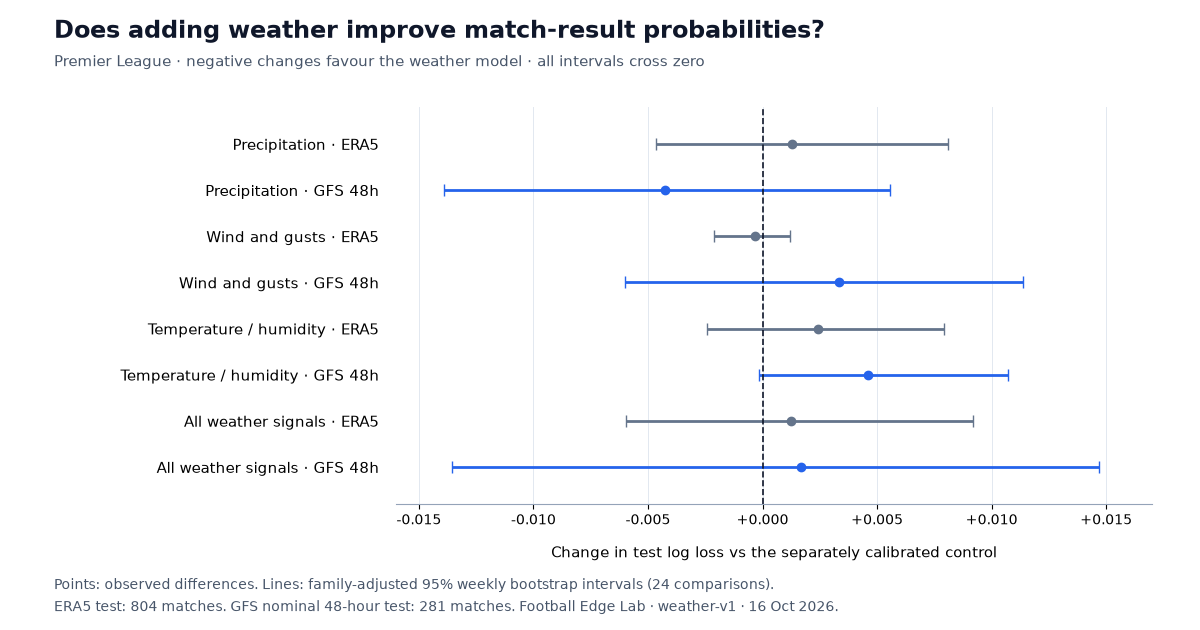
In Football Edge Lab's retrospective Premier League test against a separately calibrated goals-only control, none of 24 weather-and-target comparisons met the model-adoption rule. This does not establish that rain or other weather has no effect on matches.
Sample: Premier League only. ERA5 reanalysis: 804 test fixtures (2024-04-27 to 2026-05-24). GFS nominal 48-hour forecasts: 281 test fixtures (2025-11-03 to 2026-05-24). The samples overlap.
Limitations: Only 7 reanalysis and 4 forecast test fixtures met the hourly precipitation threshold. Precipitation includes snow; the grids do not measure pitch conditions. Forecast publication timestamps were not independently auditable.
Analysis: Football Edge Lab · Experiment weather-v1 · Control model dc-v4 · Run . Full results and sample dates · Link to this finding.
We studied Premier League results from 2019–20 onward using two separate weather tracks. ERA5 reanalysis describes weather retrospectively; it is useful for an explanatory test but cannot be used as if it were a pre-match forecast. The GFS archive supplies nominal 48-hour forecasts, covering a shorter period from 2024 onward.
| Weather track | Matched fixtures | Test fixtures | Test period |
|---|---|---|---|
| ERA5 reanalysis | 2,660 | 804 | 2024-04-27 to 2026-05-24 |
| GFS nominal 48-hour forecast | 936 | 281 | 2025-11-03 to 2026-05-24 |
Four additions were specified in each track: precipitation, wind and gusts, temperature and humidity, and all weather signals together. Precipitation combines the six hours before kickoff, the first two match hours and an indicator for an overlapping hour with at least 2 mm. It includes rain, showers and snow, rather than measuring rain alone.
| Sample / addition | Target / matches | Log-loss change | Adjusted 95% interval | Statistical gate |
|---|---|---|---|---|
| ERA5 reanalysisPrecipitation | Home / draw / away804 matches | +0.001272 | −0.004662 to +0.008112 | Not passed |
| ERA5 reanalysisWind and gusts | Home / draw / away804 matches | −0.000347 | −0.002131 to +0.001187 | Not passed |
| ERA5 reanalysisTemperature and humidity | Home / draw / away804 matches | +0.002425 | −0.002411 to +0.007903 | Not passed |
| ERA5 reanalysisAll weather signals · selected on tuning | Home / draw / away804 matches | +0.001246 | −0.005945 to +0.009199 | Not passed |
| GFS nominal 48-hour forecastPrecipitation | Home / draw / away281 matches | −0.004277 | −0.013901 to +0.005575 | Not passed |
| GFS nominal 48-hour forecastWind and gusts | Home / draw / away281 matches | +0.003347 | −0.005998 to +0.011369 | Not passed |
| GFS nominal 48-hour forecastTemperature and humidity | Home / draw / away281 matches | +0.004612 | −0.000149 to +0.010701 | Not passed |
| GFS nominal 48-hour forecastAll weather signals · selected on tuning | Home / draw / away281 matches | +0.001678 | −0.013546 to +0.014688 | Not passed |
The forecast precipitation addition improved overall test log loss by 0.004277, but its adjusted interval includes zero. Its improvement in the later half was only 0.001780, below our required 0.005. The all-weather addition was selected on tuning in both tracks; neither selected model passed.
We also tested over 2.5 goals and both teams to score. No addition passed for either target. The full-time result, goals and BTTS tests form one family of 24 comparisons; finding one promising number among them is insufficient.
All goals and BTTS weather results
| Sample / addition | Target / matches | Log-loss change | Adjusted 95% interval | Statistical gate |
|---|---|---|---|---|
| ERA5 reanalysisPrecipitation | Over 2.5 goals804 matches | +0.002925 | −0.000545 to +0.007324 | Not passed |
| ERA5 reanalysisPrecipitation | Both teams to score804 matches | +0.001609 | −0.001331 to +0.004903 | Not passed |
| ERA5 reanalysisWind and gusts | Over 2.5 goals804 matches | +0.000676 | −0.000790 to +0.002281 | Not passed |
| ERA5 reanalysisWind and gusts | Both teams to score804 matches | +0.000368 | −0.000776 to +0.001566 | Not passed |
| ERA5 reanalysisTemperature and humidity | Over 2.5 goals804 matches | +0.002028 | −0.002554 to +0.007138 | Not passed |
| ERA5 reanalysisTemperature and humidity | Both teams to score804 matches | +0.000621 | −0.002445 to +0.003664 | Not passed |
| ERA5 reanalysisAll weather signals · selected on tuning | Over 2.5 goals804 matches | +0.003994 | −0.001424 to +0.010038 | Not passed |
| ERA5 reanalysisAll weather signals · selected on tuning | Both teams to score804 matches | +0.001858 | −0.001605 to +0.005450 | Not passed |
| GFS nominal 48-hour forecastPrecipitation | Over 2.5 goals281 matches | +0.000219 | −0.005936 to +0.005645 | Not passed |
| GFS nominal 48-hour forecastPrecipitation | Both teams to score281 matches | +0.001526 | −0.004345 to +0.006785 | Not passed |
| GFS nominal 48-hour forecastWind and gusts | Over 2.5 goals281 matches | +0.000985 | −0.003730 to +0.007736 | Not passed |
| GFS nominal 48-hour forecastWind and gusts | Both teams to score281 matches | +0.001312 | −0.003062 to +0.006206 | Not passed |
| GFS nominal 48-hour forecastTemperature and humidity | Over 2.5 goals281 matches | +0.002389 | −0.002100 to +0.007503 | Not passed |
| GFS nominal 48-hour forecastTemperature and humidity | Both teams to score281 matches | −0.001122 | −0.004161 to +0.001653 | Not passed |
| GFS nominal 48-hour forecastAll weather signals · selected on tuning | Over 2.5 goals281 matches | +0.002940 | −0.007702 to +0.012031 | Not passed |
| GFS nominal 48-hour forecastAll weather signals · selected on tuning | Both teams to score281 matches | +0.002544 | −0.005465 to +0.009380 | Not passed |
Do short rest and consecutive away games help?
Study finding
In Football Edge Lab's retrospective six-league test against a separately calibrated goals-only control, none of 36 league-and-variant comparisons met the model-adoption rule. These results do not establish that fatigue has no effect on matches.
Sample: 4,894 test fixtures in six separate league samples (Premier League, Championship, La Liga, Bundesliga, Serie A, Ligue 1), using league records from 2019–20 onward. League-specific test dates are supplied with every CSV row. The tests overlap the weather and earlier model research samples.
Limitations: League-only fixtures omit cup games, national-team duty and player workload. Away sequences are venue sequences, not measured travel. There were no measured turnarounds of at most 48 hours in the test sample, so literal back-to-back games were not tested. Historical schedule announcements were not independently auditable.
Analysis: Football Edge Lab · Experiment schedule-v1 · Control model dc-v4 · Run . Full results and sample dates · Link to this finding.
The schedule study used 4,894 test fixtures across six league-specific samples, from 2019–20 onward. We tested differences in rest days, 48- and 72-hour turnarounds, league games in the preceding 7 and 14 days, consecutive away fixtures, short rest during an away sequence, and a combined adjustment.
The combined adjustment was selected on tuning in all six leagues. Five overall test scores worsened; the Bundesliga difference was almost zero. None passed the statistical gate.
| Sample / addition | Target / matches | Log-loss change | Adjusted 95% interval | Statistical gate |
|---|---|---|---|---|
| Premier LeagueAll schedule signals · selected on tuning | Home / draw / away804 matches | +0.002663 | −0.000985 to +0.006681 | Not passed |
| ChampionshipAll schedule signals · selected on tuning | Home / draw / away1,142 matches | +0.000362 | −0.001697 to +0.002444 | Not passed |
| La LigaAll schedule signals · selected on tuning | Home / draw / away799 matches | +0.001303 | −0.001508 to +0.004300 | Not passed |
| BundesligaAll schedule signals · selected on tuning | Home / draw / away647 matches | −0.000025 | −0.001384 to +0.001328 | Not passed |
| Serie AAll schedule signals · selected on tuning | Home / draw / away800 matches | +0.000277 | −0.004779 to +0.005136 | Not passed |
| Ligue 1All schedule signals · selected on tuning | Home / draw / away702 matches | +0.000078 | −0.001400 to +0.001693 | Not passed |
Of 4,894 test fixtures, 4,774 had prior same-season league history for both clubs. There were 393 fixtures with a measured turnaround of at most 72 hours, 819 second-or-later away fixtures, and only 35 third-or-later away fixtures. These categories overlap.
This did not test literal next-day back-to-back games. There were 0 measured turnarounds of at most 48 hours in the test sample. Only earlier kickoffs strictly before the forecast's 24-hour cutoff enter the history, and cup matches are absent. An away sequence is a sequence of league venues, not proof that players stayed away from home.
All five individual schedule additions in each league
| Sample / addition | Target / matches | Log-loss change | Adjusted 95% interval | Statistical gate |
|---|---|---|---|---|
| Premier LeagueRest-day difference | Home / draw / away804 matches | +0.001284 | −0.000441 to +0.003280 | Not passed |
| Premier LeagueShort rest (48 / 72 hours) | Home / draw / away804 matches | +0.000459 | −0.002130 to +0.003548 | Not passed |
| Premier LeagueLeague games in 7 / 14 days | Home / draw / away804 matches | +0.000142 | −0.000149 to +0.000480 | Not passed |
| Premier LeagueConsecutive away games | Home / draw / away804 matches | +0.000293 | −0.000842 to +0.001542 | Not passed |
| Premier LeagueShort rest with repeated away games | Home / draw / away804 matches | +0.000002 | −0.000170 to +0.000191 | Not passed |
| ChampionshipRest-day difference | Home / draw / away1,142 matches | −0.000172 | −0.000714 to +0.000298 | Not passed |
| ChampionshipShort rest (48 / 72 hours) | Home / draw / away1,142 matches | +0.000615 | −0.000898 to +0.002206 | Not passed |
| ChampionshipLeague games in 7 / 14 days | Home / draw / away1,142 matches | +0.000051 | −0.000591 to +0.000660 | Not passed |
| ChampionshipConsecutive away games | Home / draw / away1,142 matches | +0.000098 | −0.000708 to +0.000876 | Not passed |
| ChampionshipShort rest with repeated away games | Home / draw / away1,142 matches | −0.000061 | −0.000346 to +0.000111 | Not passed |
| La LigaRest-day difference | Home / draw / away799 matches | +0.000744 | −0.000173 to +0.001763 | Not passed |
| La LigaShort rest (48 / 72 hours) | Home / draw / away799 matches | +0.000051 | −0.001851 to +0.002316 | Not passed |
| La LigaLeague games in 7 / 14 days | Home / draw / away799 matches | −0.000159 | −0.001032 to +0.000769 | Not passed |
| La LigaConsecutive away games | Home / draw / away799 matches | −0.000030 | −0.000207 to +0.000144 | Not passed |
| La LigaShort rest with repeated away games | Home / draw / away799 matches | −0.000003 | −0.000017 to +0.000005 | Not passed |
| BundesligaRest-day difference | Home / draw / away647 matches | −0.000410 | −0.001782 to +0.001026 | Not passed |
| BundesligaShort rest (48 / 72 hours) | Home / draw / away647 matches | −0.000387 | −0.001266 to +0.000023 | Not passed |
| BundesligaLeague games in 7 / 14 days | Home / draw / away647 matches | +0.000338 | −0.000429 to +0.001133 | Not passed |
| BundesligaConsecutive away games | Home / draw / away647 matches | +0.000112 | −0.000407 to +0.000604 | Not passed |
| BundesligaShort rest with repeated away games | Home / draw / away647 matches | +0.000037 | −0.000028 to +0.000196 | Not passed |
| Serie ARest-day difference | Home / draw / away800 matches | +0.000475 | −0.000966 to +0.002018 | Not passed |
| Serie AShort rest (48 / 72 hours) | Home / draw / away800 matches | −0.000088 | −0.002141 to +0.001686 | Not passed |
| Serie ALeague games in 7 / 14 days | Home / draw / away800 matches | +0.000300 | −0.002868 to +0.003480 | Not passed |
| Serie AConsecutive away games | Home / draw / away800 matches | −0.000279 | −0.002708 to +0.002244 | Not passed |
| Serie AShort rest with repeated away games | Home / draw / away800 matches | −0.000057 | −0.000231 to +0.000015 | Not passed |
| Ligue 1Rest-day difference | Home / draw / away702 matches | +0.000149 | −0.000812 to +0.001113 | Not passed |
| Ligue 1Short rest (48 / 72 hours) | Home / draw / away702 matches | +0.000015 | −0.000364 to +0.000268 | Not passed |
| Ligue 1League games in 7 / 14 days | Home / draw / away702 matches | −0.000120 | −0.001496 to +0.001249 | Not passed |
| Ligue 1Consecutive away games | Home / draw / away702 matches | +0.000053 | −0.000471 to +0.000535 | Not passed |
| Ligue 1Short rest with repeated away games | Home / draw / away702 matches | +0.000001 | −0.000000 to +0.000004 | Not passed |
Schedule test periods and sample sizes
- Premier League: 804 fixtures, 2024-04-27 to 2026-05-24.
- Championship: 1,142 fixtures, 2024-04-20 to 2026-05-02.
- La Liga: 799 fixtures, 2024-05-11 to 2026-05-24.
- Bundesliga: 647 fixtures, 2024-04-27 to 2026-05-16.
- Serie A: 800 fixtures, 2024-05-04 to 2026-05-24.
- Ligue 1: 702 fixtures, 2024-03-08 to 2026-05-17.
How we tested the additions
The control is a fixed Dixon–Coles goals model, with a 365-day rating half-life and shrinkage setting of 4. Forecasts are made as of 24 hours before kickoff and team ratings are refitted every 28 days. The control excludes player-availability adjustments and is not a replay of every historical production setting.
Each sample is split chronologically: roughly 40% for tuning, 30% for calibrating confidence and 30% for testing. Unavailable match outcomes are purged at the stage boundaries. Addition weights are fitted on tuning only; control and candidate confidence are calibrated separately. The final block is evaluated without choosing settings from its results.
Weather additions adjust goal rates, so we can test match results, over 2.5 goals and BTTS. Schedule additions adjust relative home/draw/away probabilities; this experiment does not test schedule effects on total goals. Missing same-season schedule history produces no adjustment.
Our adoption rule requires log loss to fall by more than 0.005 and Brier score to fall in each chronological test half. We also require the upper end of an uncertainty interval to be below zero. We resample whole weeks 20,000 times, with Bonferroni adjustment separately over 24 weather comparisons and 36 schedule comparisons. Lower scores are better; a log-loss improvement is not a percentage-point increase in accuracy or evidence of betting profit.
The two experiment families share football matches. Weather test tracks also overlap. Their match counts cannot be added to describe independent evidence, and all results are retrospective on historical seasons studied previously.
What we cannot conclude
- Heavy-weather evidence is limited. Only 7 reanalysis test fixtures and 4 forecast test fixtures met the hourly precipitation threshold. The grids do not measure pitch drainage, roofs, surface wetness or a local shower directly.
- Real fatigue is incompletely measured. Domestic cups, European matches, national-team duty, extra time, travel distance and individual player minutes are missing. A league-only rest gap can overstate actual recovery time.
- Historical availability is not fully auditable. The forecast archive does not return the original publication and ingestion timestamps used by this study. Fixture records contain final played kickoff times, without historical announcement or postponement timestamps. These gaps independently prevent live adoption, even if a future retrospective score looks better.
- Association is not causation. These tests ask whether specified signals improve this control on these samples. They cannot establish that rain never changes matches, that fatigue is irrelevant, or that a different feature design would fail.
Decision: keep the published model unchanged. Better all-competition schedules, player workload data and forecasts saved before kickoff would make a stronger next experiment. A fresh prospective sample is needed before treating an apparent improvement as confirmed.
Data, sources and citation
Download all 60 comparisons as CSV, including exact log-loss and Brier differences, adjusted intervals, sample dates and tuning selections. Tables round values to six decimals; the CSV retains the stored precision.
Weather data: Open-Meteo, using ECMWF ERA5 reanalysis and NOAA GFS forecasts, under CC BY 4.0. See the historical weather and previous runs documentation. Stadium coordinates come from the linked Wikipedia sources in our venue register; Everton's ground change is handled by date. Match-level neutral venues are not verified.
Football scores and kickoff records use this project's historical football-data.co.uk, football-data.org and OpenFootball archives. These sources are combined with the coverage rules described in the model methodology.
Audit the weather report, schedule report and experiment code. Reports retain source and snapshot hashes. Reproducing the full run requires the matching archived inputs; raw API caches are not included in the repository.
Cite: Football Edge Lab (2026). Do Weather and Fixture Congestion Improve Football Predictions? Experiments weather-v1 and schedule-v1, model dc-v4. https://footballedgelab.com/research/weather-and-fixture-congestion.